Brn.Gui: Difference between revisions
No edit summary |
No edit summary |
||
| Line 10: | Line 10: | ||
=== Properties Data === |
=== Properties Data === |
||
[[Image:properties_data.jpg|none||left|thumb|300px|Brn.Gui displaying the current configuration (Properties Data).]] |
[[Image:properties_data.jpg|none||left|thumb|300px|Brn.Gui displaying the current configuration (Properties Data).]] |
||
For plain Java objects a tree is populated in the Properties View showing its JavaBean accessible members. |
|||
<br style="clear:both;"/> |
<br style="clear:both;"/> |
||
=== Diagrams === |
=== Diagrams === |
||
[[Image:BrnGuiThroughput.jpg|none||left|thumb|300px|Brn.Gui displaying a throughput diagram.]] |
[[Image:BrnGuiThroughput.jpg|none||left|thumb|300px|Brn.Gui displaying a throughput diagram.]] |
||
Brn.Gui visualizes diagram data using the [http://www.epic.noaa.gov/java/sgt/ SGT Graphics Package]. |
|||
<br style="clear:both;"/> |
<br style="clear:both;"/> |
||
=== Time Bars === |
=== Time Bars === |
||
| ⚫ | |||
[[Image:Brn.Gui-Timebar.png|none||left|thumb|400px|Brn.Gui displaying the Radio Packet Time-Bar.]] |
[[Image:Brn.Gui-Timebar.png|none||left|thumb|400px|Brn.Gui displaying the Radio Packet Time-Bar.]] |
||
The Time Bar graphs show packet transmission/reception or internal states and changes in relation to time. It can be seen as Message Sequence Chart or a UML sequence diagram (but with missing edges...). For visualization Brn.Gui uses the [http://www.jaret.de/timebars jaret timebars]. Many thanks to Peter Kliem for providing these fantastic tools. |
|||
| ⚫ | |||
<br style="clear:both;"/> |
<br style="clear:both;"/> |
||
=== Forward |
=== Link Quality, Signal Strength and Forward Graph === |
||
=== Link Quality and Signal Strength Graph === |
|||
[[Image:Brn.Gui-500Nodes.png|none|left|thumb|400px|Brn.Gui showing the link quality graph in a network with 500 nodes.]] |
[[Image:Brn.Gui-500Nodes.png|none|left|thumb|400px|Brn.Gui showing the link quality graph in a network with 500 nodes.]] |
||
Brn.Gui uses graph editors generated by [http://www.eclipse.org/gmf/ GMF] for displaying several graphs like the displayed link quality graph. |
|||
<br style="clear:both;"/> |
<br style="clear:both;"/> |
||
=== TcpTrace Diagrams === |
=== TcpTrace Diagrams === |
||
[[Image:BrnGuiTcpTrace.jpg|none|left|thumb|400px|Brn.Gui displaying the tcptrace time-sequence graph of a TCP flow.]] |
[[Image:BrnGuiTcpTrace.jpg|none|left|thumb|400px|Brn.Gui displaying the tcptrace time-sequence graph of a TCP flow.]] |
||
[http://jarok.cs.ohiou.edu/software/tcptrace/ Tcptrace] is a powerful tool for analyzing TCP flows. We ported tcptrace to Java and integrated it into the Brn.Measure framework. For displaying tcptrace graphs in Brn.Gui we are using [http://masaka.cs.ohiou.edu/software/jPlot/ jPlot]. |
|||
<br style="clear:both;"/> |
<br style="clear:both;"/> |
||
Latest revision as of 14:24, 16 March 2008
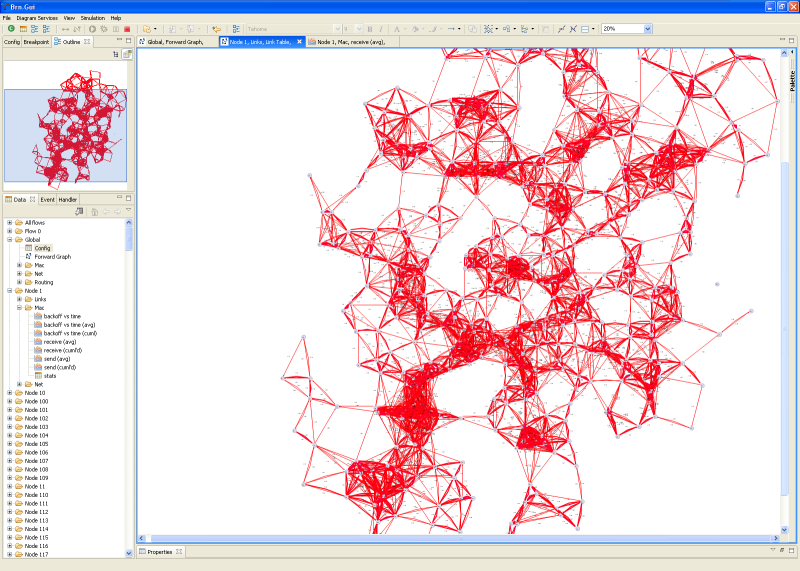
The Brn.Gui is a user interface for the Brn.Sim simulator. It is able to control the simulation execution like a debugger. It visualizes simulation results which are specified in simulation code via the Brn.Measure framework. Furthermore, it is also a result browser for already completed simulations which were executed by the Brn.DistSim distributed simulation framework and stored in the Brn.Db storage.
Features
Execution Control
Real-Time Visualization of Simulation Results
Properties Data
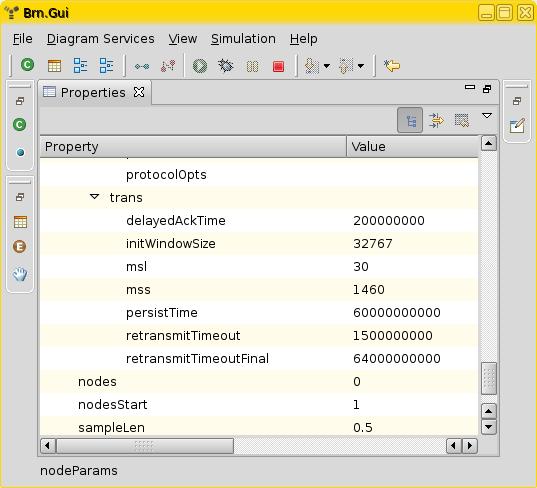
For plain Java objects a tree is populated in the Properties View showing its JavaBean accessible members.
Diagrams
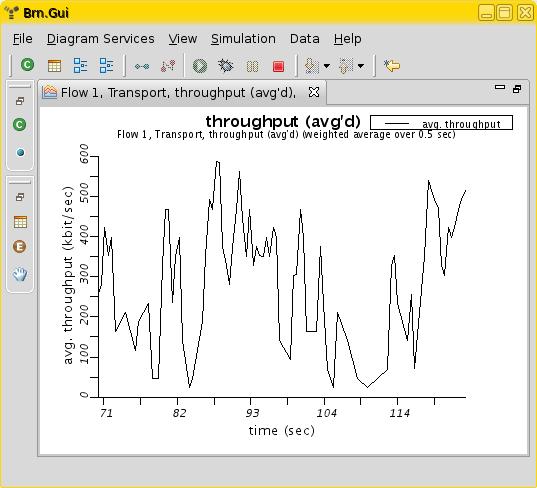
Brn.Gui visualizes diagram data using the SGT Graphics Package.
Time Bars
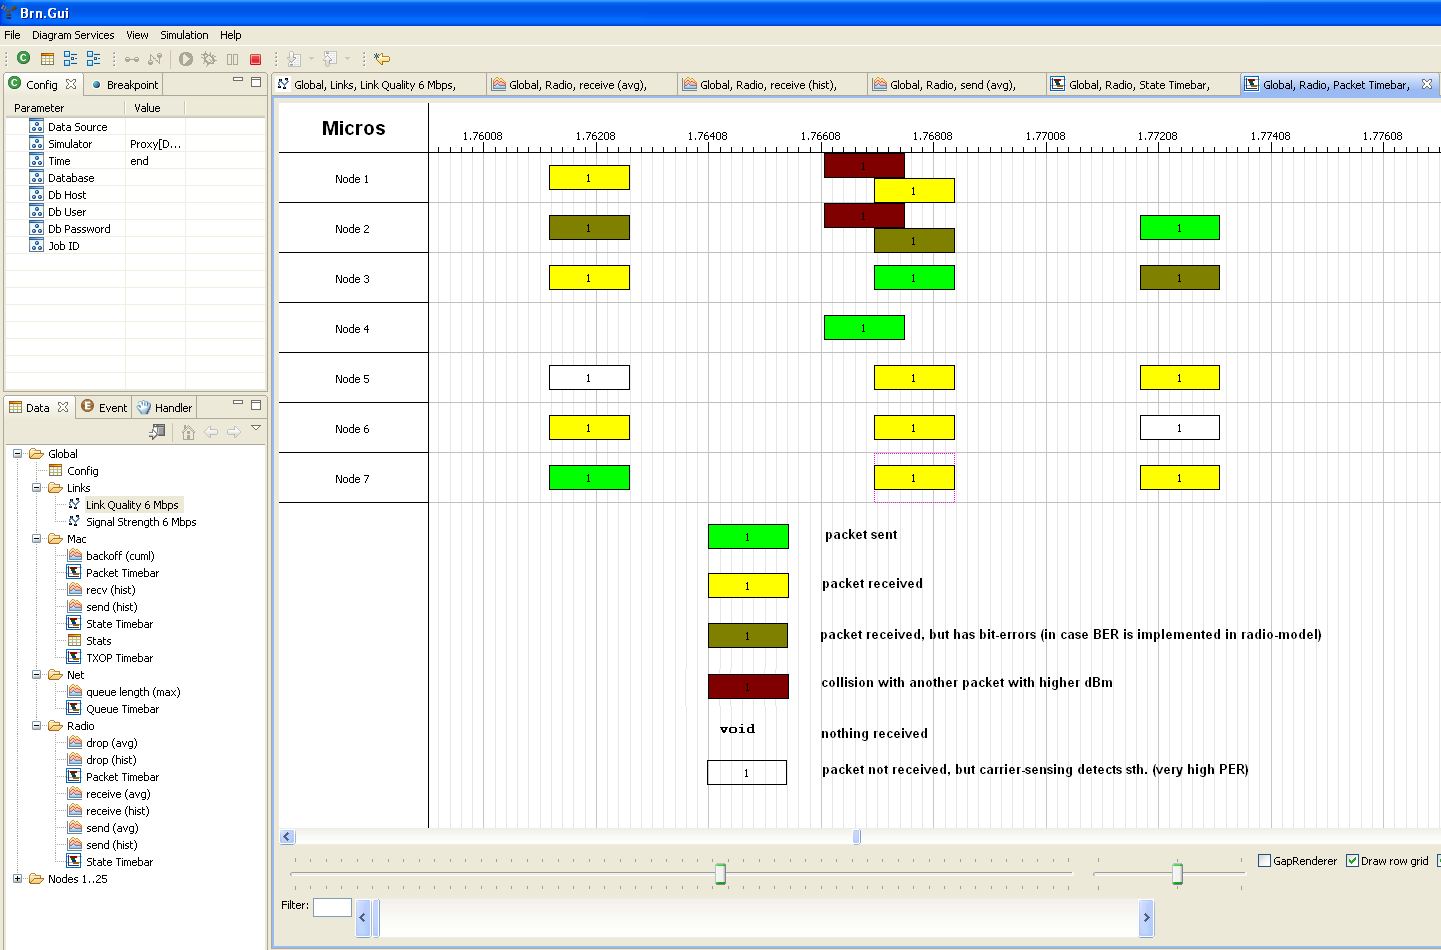
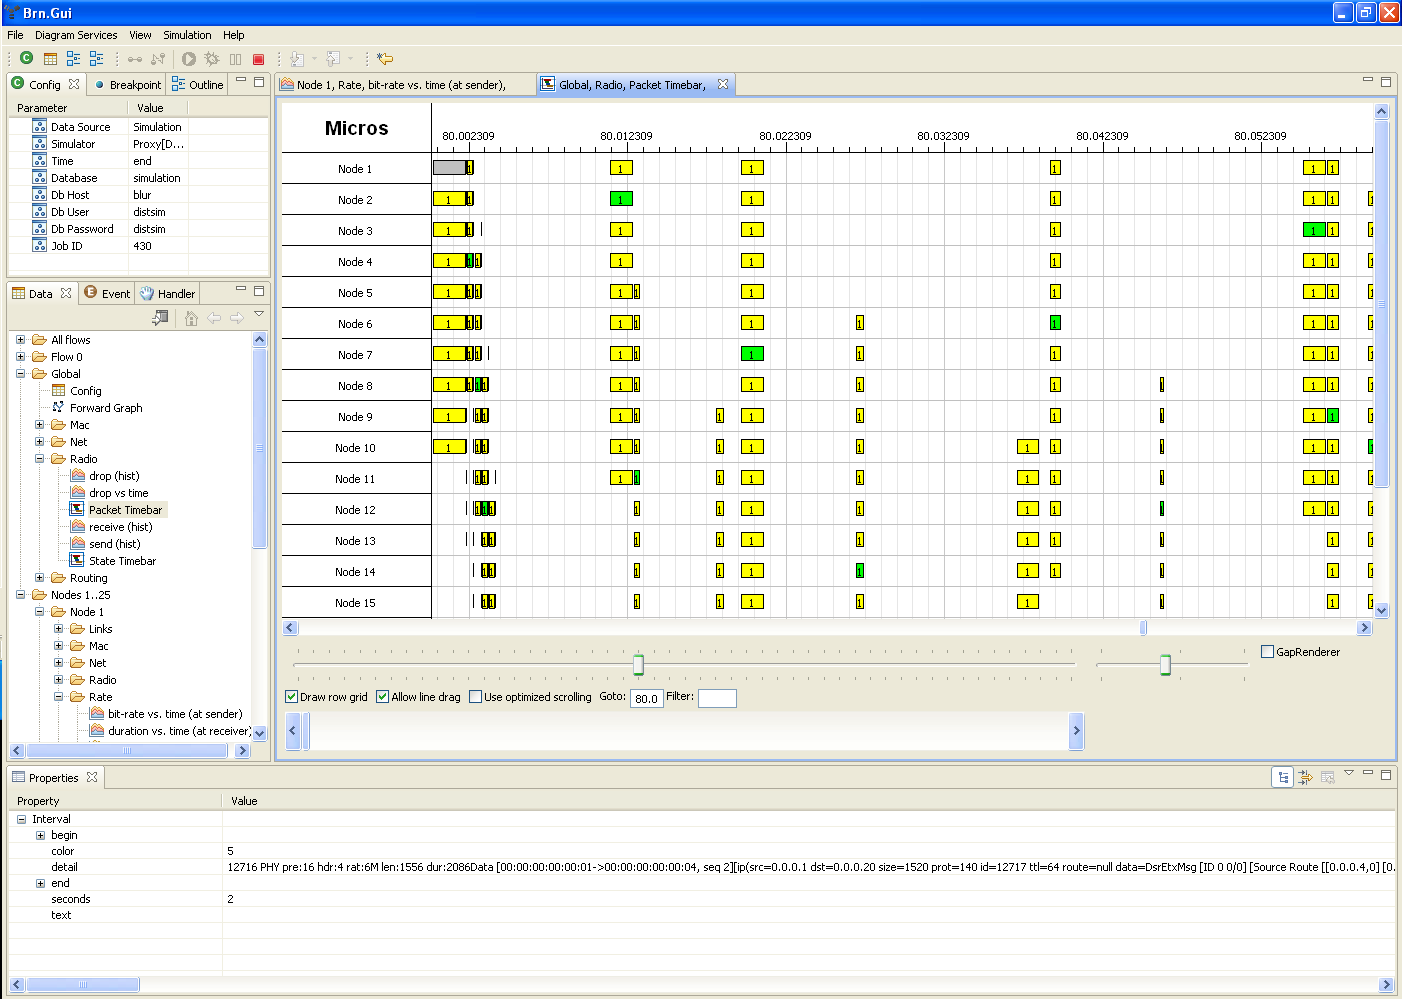
The Time Bar graphs show packet transmission/reception or internal states and changes in relation to time. It can be seen as Message Sequence Chart or a UML sequence diagram (but with missing edges...). For visualization Brn.Gui uses the jaret timebars. Many thanks to Peter Kliem for providing these fantastic tools.
Link Quality, Signal Strength and Forward Graph

Brn.Gui uses graph editors generated by GMF for displaying several graphs like the displayed link quality graph.
TcpTrace Diagrams
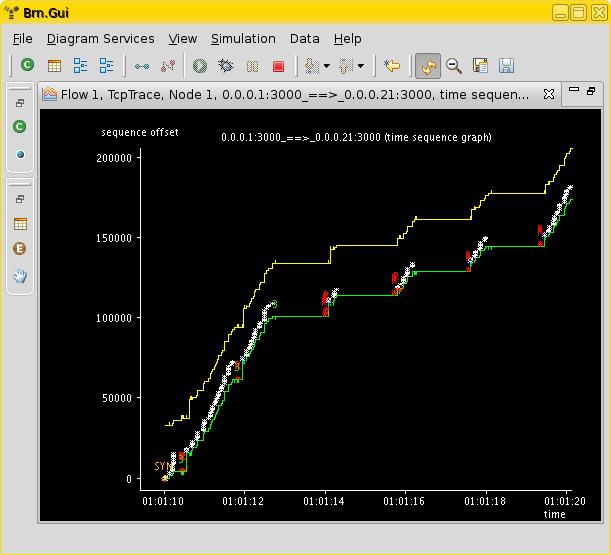
Tcptrace is a powerful tool for analyzing TCP flows. We ported tcptrace to Java and integrated it into the Brn.Measure framework. For displaying tcptrace graphs in Brn.Gui we are using jPlot.
Visualization of Database Simulation Results
Brn.Gui can be used to visualize simulation results stored in database in almost the same way as for real-time data. Specify "Database" as Data Source in the Config View and put in the connection information and the id of the simulation to use. The Data View will be populated in the same way as for real-time simulation data.
Implementation Details
The Brn.Gui is a stand-alone Eclipse RCP application. A Brn.Sim instance can be connected to the Brn.Gui via Java RMI. The out-of-process architecture (and the resulting RMI overhead) is mainly technical: the usage of custom classloader during simulation causes several problems which RMI solves through serialization.